Gas
China Sign LNG Deal With The UAE Amid US Trade War

China agreed on April 21 to a term deal to buy liquefied natural gas (LNG) from the United Arab Emirates (UAE).
The LNG deal occurred amid China’s trade war with the United States. In early February, following US President Donald Trump’s first round of tariffs, China imposed a 15% tariff on US LNG imports.
As a result, Chinese buyers were already halting US LNG imports with the 15% tariff. According to Kpler and the London Stock Exchange Group data, China did not import any LNG from the US in March.
In 2024, the US accounted for about 5% of China’s LNG imports. The US is the world’s largest LNG exporter, exporting 11.9 billion cubic feet per day (Bcf/d) of LNG in 2024. China is the world’s largest LNG importer.
Therefore, the tariff dispute has pushed China to divert from US-sourced LNG as retaliatory tariffs have increased import costs.
Overview of the China-UAE LNG Deal
The cornerstone of the China-UAE LNG deal involves partnerships between three Chinese energy companies — CNOOC, ENN Natural Gas, and Zhenhua Oil — and the UAE’s national energy giant, Abu Dhabi National Oil Company (ADNOC).
CNOOC Gas & Power – ADNOC LNG Deal
- Parties: China National Offshore Oil Corporation (CNOOC) & ADNOC
- Volume: 500,000 metric tons of LNG per year
- Duration: 5 years (starting in 2026)
- Purpose: Securing stable LNG supplies outside the US market.
ENN Natural Gas – ADNOC LNG Deal
- Parties: ENN Natural Gas & ADNOC
- Volume: 1 million metric tons of LNG per year
- Duration: 15 years (starting in 2028)
Zhenhua Oil – ADNOC LNG Deal
- Parties: Zhenhua Oil & ADNOC
- Volume: Up to 12 cargoes per year (about 780 kt of LNG)
- Duration: 5 years (starting in 2026)
China’s LNG Demand Growth
China’s LNG market appears to be booming. According to Kpler data, the country imported 78 million tons (MT) in 2024. Imports came from Australia (34%), Qatar (24%), Malaysia (10%), Russia (9%), and the United States (6%).
In 2023, China imported 72 million tons of LNG, compared to 78.8 million tons in 2021. Therefore, China’s LNG demand is between 70 and 79 million tons annually. However, it is expected to reach about 100+ million tons (MT) by 2030.
China’s growing demand for natural gas is driven by industrial demands, urban heating, and environmental reforms.
China’s LNG Deal with the UAE Amid Trade War with the United States
Since returning to the White House in January, President Trump has imposed massive tariffs on Chinese imports. In addition, the US imposed tariffs on key trading partners to reduce the US trade deficit and the ballooning US debt. Meanwhile, China has pushed back by imposing 125% tariffs on US imports.
Therefore, with rising tensions, China is increasingly looking to Middle Eastern and African partners for LNG to reduce over-reliance on US LNG.
Thus, China’s LNG deal with the UAE directly reduces its reliance on US LNG. In fact, US LNG exports to China dropped to zero as of March 2025, partly due to tit-for-tat tariffs.
China has been actively expanding deals with alternative suppliers like Qatar, Russia, and now the UAE. By securing supplies from the UAE, China reduces exposure to potential US export restrictions linked to geopolitical risks.
Besides reducing its geopolitical risk, China’s LNG deal with the UAE would enable it to gain leverage during trade talks. China can’t meet its LNG demand without US supplies. Therefore, the LNG deal with the UAE would serve as a bargaining chip in trade talks with the United States.
Furthermore, the shipping routes from the UAE to China are much quicker than those from US Gulf Coast terminals. Thus, China’s LNG deal with the UAE means lower freight costs and faster delivery times, which will improve China’s supply chain efficiency.
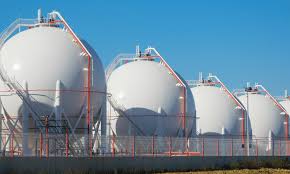
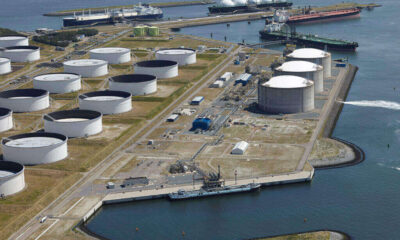
UAE LNG
The UAE is a leading LNG powerhouse in the Middle East. It produces LNG primarily from its large natural gas reserves. The country’s strategic location allows for easy access to global shipping routes, making it an attractive LNG source for international markets, especially in Asia and Europe.
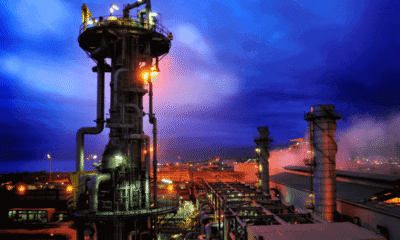
- LNG plant:
- Das Island: Operational
- Ruwais LNG Project: to commence in 2028
- Operators:
- Das Island: ADNOC
- Ruwais LNG: ADNOC (60%), Shell (10%), TotalEnergies (10%), BP (10%), Mitsui (10%).
- Production Capacity:
- Das Island: 6 million metric tons per annum of LNG production
- Ruwais: 9.6 million metric tons per annum.
- Proven Gas Reserves: 290 Trillion Cubic Feet
Geopolitical and Market Impacts
The China-UAE LNG deal is more than just a commercial deal; it also has a significant geopolitical impact.
Global LNG trade is gradually becoming regionally segmented. While China turns to Africa, Russia, and the Middle East for supplies, Europe relies more on the US and Norway.
China’s LNG deal with the UAE signalled moves to reduce reliance on US supplies, which could potentially cut into America’s future LNG export earnings. US LNG exporters like Cheniere Energy had relied on China as a significant growth market. Thus, US LNG companies would have to compete harder for market share in Japan, South Korea, and Europe.
The LNG deal presents a significant opportunity for Yuan-Dirham LNG Trade. In March 2023, China and French energy giant TotalEnergies completed China’s first yuan-settled LNG trade through the Chinese energy trading centre Shanghai Petroleum and Natural Gas Exchange (SHPGX).
According to SHPGX, TotalEnergies supplied CNOOC with about 65,000 tons of LNG imported from the UAE. The transaction was settled using the Chinese currency.
In November 2023, China and the UAE renewed their five-year currency swap deal, which started in 2012. In March 2023, the two sides made the first-ever purchase of LNG in Yuan. While the UAE remains a US security partner (it hosts US troops), it is also deepening economic ties with China.
Thus, the LNG deal offers a broader opportunity for China-UAE trade using local currencies instead of the US Dollar. With the UAE already a BRICS member, it further cements China-UAE ties.
The LNG deal deepens China’s overall influence in the Gulf region, which has been under strong US strategic, economic, and military influence.
The growing economic and trade ties between China and the Middle East, especially the Gulf Cooperation Council states, occurred gradually.
For China, the Belt and Road Initiative and its energy needs pushed it towards the Gulf Cooperation Council. Apart from infrastructure developments, the BRI Action Plan also emphasises the internationalisation of the Yuan and cross-border payment agreements.
As such, China launched the Yuan Cross-Border Interbank Payment System to provide a reliable platform for cross-border yuan settlement.
Apart from the UAE, China has currency swap deals with Saudi Arabia and Qatar. Saudi companies were listed on the Hong Kong Stock Exchange.
In addition, China has signed cross-border trade settlement arrangements with all six Gulf Cooperation Council members.
For the GCC members, as key oil and LNG exporters to China, China is a significant market for energy exports.
China’s long-term partnerships with the UAE could set a precedent for deeper Gulf-China energy ties.


The Kwale Gas Gathering (KGG) plant plans to undergo expansion to reach 600 million standard cubic feet daily. KGG facility was designed to process stranded gas resources in OML56.

Gas prices surged in the US and the UK, but held steady in Continental Europe on May 27, 2025, amid growing concerns over supply disruptions.
Prices remain after unplanned capacity cuts were announced at Norway’s massive Troll gas field due to external power issues, compounding ongoing maintenance at other key sites like Nyhamna and Aasta Hansteen.
Norway is under pressure to maintain stable flows as Europe scrambles to refill gas storage, currently at just 45%.
The US natural gas price closed at roughly $3.753/MMBtu on May 27, compared with 3.667/MMBtu recorded on May 27.
UK natural gas futures topped to 88.46 pence per therm up from 87.15 recorded on May 26.
European natural gas futures topped €37.00/MWh on May 27, down from €37.25/MWh recorded on May 26.
Read: Natural Gas Prices May 26, 2025: US, UK & Europe
Major Natural Gas Price Benchmarks
Region | Benchmark | Key Features |
United States | Henry Hub (NYMEX) | Reflects supply/demand in North America Tied to US shale gas production & pipeline infrastructure dynamics |
Europe | TTF (Netherlands) | Europe's leading gas benchmark Reflects LNG and pipeline flows from Russia, Norway, and LNG imports |
Asia | JKM (Japan-Korea LNG) | Reflects Asian demand, LNG deliveries to Japan & South Korea |
United Kingdom | NBP (National Balance Point) | Linked to European gas markets Influenced by LNG & North Sea supply Futures |
Other benchmarks include
- Oil-Linked Pricing: Some long-term contracts ( Russia’s Gazprom pipeline gas exports) still use oil-indexed pricing. Gazprom has long preferred long-term contracts and hybrid pricing with spot elements to hedge against price volatility.
- AECO Canada: It is Canada’s benchmark linked to Western Canada’s pipeline gas supply
Key Factors Influencing Natural Gas Prices
Several supply and demand factors influence natural gas prices. Below is a detailed breakdown of key aspects affecting natural gas prices:
Supply Factors
- Production Levels: Qatar, Russia, and US shale gas production heavily influence global supply. Thanks to fracking technology, the US is already the world’s top natural gas producer. Thus, higher gas production by these countries can push prices down due to oversupply.
- Storage Inventories: Natural gas is stored in underground facilities. Thus, high storage levels generally lead to lower prices. At the same time, low storage levels signal scarcity, leading to price surges.
- Imports/Exports: Fluctuations in gas exports via pipelines or LNG from key producers can significantly affect regional prices. For instance, European gas prices soared by 30% in September 2022 following the indefinite shutdown of Russia’s Nord Stream 1 pipeline. The pipeline, which runs under the Baltic Sea to Germany, historically supplied between 50 – 55 BCM/year of gas to Europe. Likewise, rising liquefied natural gas (LNG) exports by Qatar, Australia, and the US can lead to oversupply and lower prices.
Demand
- Electricity Sector Competition: Countries rely on various sources for power generation, including natural gas, nuclear power, coal, and renewable energy like wind and solar. Suppose the prices of coal and renewables increase. In such developments, electricity producers will shift to natural gas. Conversely, if coal or renewable sources become cheaper, demand for gas will fall, resulting in lower gas prices.
- Weather conditions: Weather plays a significant role in influencing natural gas prices. During the summer, there is a massive surge in the demand, especially in Europe & North America, for air conditioning systems. The high demand for electricity to cool homes and industrial plants can increase natural gas prices. At the same time, during the cold winter season, there is increased gas demand, especially across Europe, North America, and East Asia, to heat homes and industries. When chilly weather hits—like snowstorms or Arctic blasts—it can freeze up gas wells. That means less output, slower deliveries, and higher prices. Hurricanes often shut down oil and gas operations temporarily, pushing prices higher.
- Economic Growth: Strong global economic growth, especially in the US, China, Japan, South Korea, and the EU, boosts industrial demand for natural gas. The manufacturing sector (chemicals, automotive, petrochemicals) depends heavily on gas for feedstock and power generation. However, a weak global economic outlook reduces gas demand, and thus, prices drop.
Geopolitics
- Geopolitical tensions, such as the 2023-2025 Middle East Crisis and the 2022-2025 Russia-Ukraine war, negatively impact gas prices. These tensions disrupt pipeline gas or LNG supplies from producing countries (Russia, Qatar, Australia) to Europe, causing price spikes.
- Russia-Ukraine War: Sanctions on Russian gas disrupted gas supplies to Europe, causing price surges.
- Middle East Conflicts: The tensions in the Middle East impact LNG exporters like Qatar. Following the Houthi Rebel attacks on commercial shipping passing along the Red Sea, Qatar has detoured its LNG tankers towards the Cape of Good Hope (Southern Africa), a much longer route to export LNG to its European clients.

Gas prices saw mixed reactions in the US, the UK & Continental Europe on May 26, 2025, amid growing concerns over supply disruptions.
Prices rose in Europe after unplanned capacity cuts were announced at Norway’s massive Troll gas field due to external power issues, compounding ongoing maintenance at other key sites like Nyhamna and Aasta Hansteen.
Equinor extended a partial outage at Troll until May 30 following a compressor failure. The outage, which began after the field’s annual one-day stop-start test on May 21, has affected output by 34.6 million cubic meters per day, leaving Troll’s remaining capacity at 90 mcm/d.
Norway is under pressure to maintain stable flows as the continent scrambles to refill gas storage, currently at just 45%. Geopolitical tensions also weigh on sentiment, particularly as hopes for a Ukraine peace deal continue to fade.
The US natural gas price closed at roughly $3.66/MMBtu on May 26, compared with 3.75/MMBtu recorded on May 25.
UK natural gas futures held steady at 87.15 pence per therm.
European natural gas futures topped €37.25/MWh on May 26, up from €36.45/MWh recorded on May 23.
Read: Natural Gas Prices May 20, 2025: US, UK & Europe
Major Natural Gas Price Benchmarks
Region | Benchmark | Key Features |
United States | Henry Hub (NYMEX) | Reflects supply/demand in North America Tied to US shale gas production & pipeline infrastructure dynamics |
Europe | TTF (Netherlands) | Europe's leading gas benchmark Reflects LNG and pipeline flows from Russia, Norway, and LNG imports |
Asia | JKM (Japan-Korea LNG) | Reflects Asian demand, LNG deliveries to Japan & South Korea |
United Kingdom | NBP (National Balance Point) | Linked to European gas markets Influenced by LNG & North Sea supply Futures |
Other benchmarks include
- Oil-Linked Pricing: Some long-term contracts ( Russia’s Gazprom pipeline gas exports) still use oil-indexed pricing. Gazprom has long preferred long-term contracts and hybrid pricing with spot elements to hedge against price volatility.
- AECO Canada: It is Canada’s benchmark linked to Western Canada’s pipeline gas supply
Key Factors Influencing Natural Gas Prices
Several supply and demand factors influence natural gas prices. Below is a detailed breakdown of key aspects affecting natural gas prices:
Supply Factors
- Production Levels: Qatar, Russia, and US shale gas production heavily influence global supply. Thanks to fracking technology, the US is already the world’s top natural gas producer. Thus, higher gas production by these countries can push prices down due to oversupply.
- Storage Inventories: Natural gas is stored in underground facilities. Thus, high storage levels generally lead to lower prices. At the same time, low storage levels signal scarcity, leading to price surges.
- Imports/Exports: Fluctuations in gas exports via pipelines or LNG from key producers can significantly affect regional prices. For instance, European gas prices soared by 30% in September 2022 following the indefinite shutdown of Russia’s Nord Stream 1 pipeline. The pipeline, which runs under the Baltic Sea to Germany, historically supplied between 50 – 55 BCM/year of gas to Europe. Likewise, rising liquefied natural gas (LNG) exports by Qatar, Australia, and the US can lead to oversupply and lower prices.
Demand
- Electricity Sector Competition: Countries rely on various sources for power generation, including natural gas, nuclear power, coal, and renewable energy like wind and solar. Suppose the prices of coal and renewables increase. In such developments, electricity producers will shift to natural gas. Conversely, if coal or renewable sources become cheaper, demand for gas will fall, resulting in lower gas prices.
- Weather conditions: Weather plays a significant role in influencing natural gas prices. During the summer, there is a massive surge in the demand, especially in Europe & North America, for air conditioning systems. The high demand for electricity to cool homes and industrial plants can increase natural gas prices. At the same time, during the cold winter season, there is increased gas demand, especially across Europe, North America, and East Asia, to heat homes and industries. When chilly weather hits—like snowstorms or Arctic blasts—it can freeze up gas wells. That means less output, slower deliveries, and higher prices. Hurricanes often shut down oil and gas operations temporarily, pushing prices higher.
- Economic Growth: Strong global economic growth, especially in the US, China, Japan, South Korea, and the EU, boosts industrial demand for natural gas. The manufacturing sector (chemicals, automotive, petrochemicals) depends heavily on gas for feedstock and power generation. However, a weak global economic outlook reduces gas demand, and thus, prices drop.
Geopolitics
- Geopolitical tensions, such as the 2023-2025 Middle East Crisis and the 2022-2025 Russia-Ukraine war, negatively impact gas prices. These tensions disrupt pipeline gas or LNG supplies from producing countries (Russia, Qatar, Australia) to Europe, causing price spikes.
- Russia-Ukraine War: Sanctions on Russian gas disrupted gas supplies to Europe, causing price surges.
- Middle East Conflicts: The tensions in the Middle East impact LNG exporters like Qatar. Following the Houthi Rebel attacks on commercial shipping passing along the Red Sea, Qatar has detoured its LNG tankers towards the Cape of Good Hope (Southern Africa), a much longer route to export LNG to its European clients.

-

 Business News5 months ago
Nigeria’s Oil and Gas Reserves 2025 Reach 37 billion barrels & 210.5 TCF
-
 Analysis & Opinions5 months ago
Top Oil Producing States in Nigeria
-
 Gas4 months ago
NLNG Enters a Gas Supply Deal with Seplat Energy
-
 Analysis & Opinions5 months ago
Complete List of All Refineries Operating in the UK
-
 Oil5 months ago
Crude Oil Prices May 5, 2025: Brent & WTI Rates
-
 Oil5 months ago
Saudi Aramco Increases June Oil Prices For Asia Amid OPEC+ Supply Hike
Pingback: Russia and China in Talks on Stalled Power of Siberia 2 Pipeline - Nigeria Oil Digest